

Turning raw HR data into actionable business insights requires a centralized visualization screen. The PayPeople Analytics Hub combines complex backend data into four highly visual dashboards—People Overview, Leave / Absence, Presence Insight, and Payroll—allowing executives and administrators to track employee numbers, analyze attendance trends, evaluate company diversity, and review payroll costs instantly.
1. Opening the Central Analytics Panel
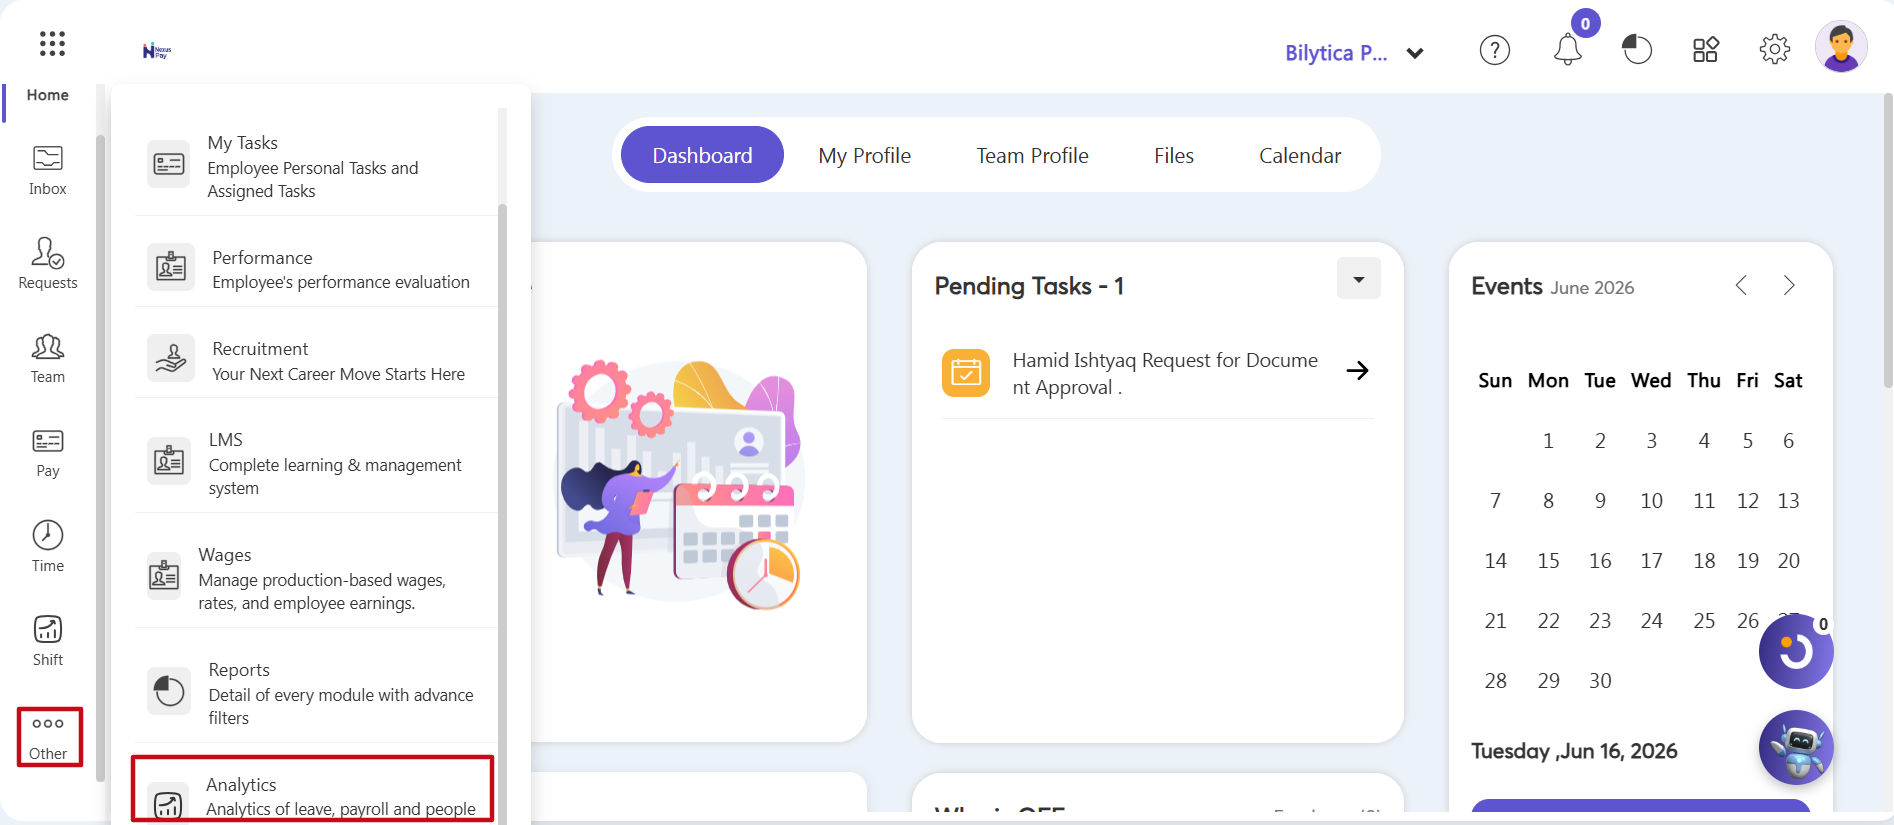
To bypass regular data tables and open the main analytics reporting screen:
- Step 1: Open the Expanded Menu — Go to the main left-hand vertical toolbar. Find the three-dot icon at the bottom of the list and click the Other option box (marked with a red box).
- Step 2: Launch the Analytics Dashboard — An expanded menu drawer will slide out over your screen. Scroll to the bottom of the categories list and click directly on the Analytics module card (marked with a red box).
2. Using the 4 Core Analytics Dashboards
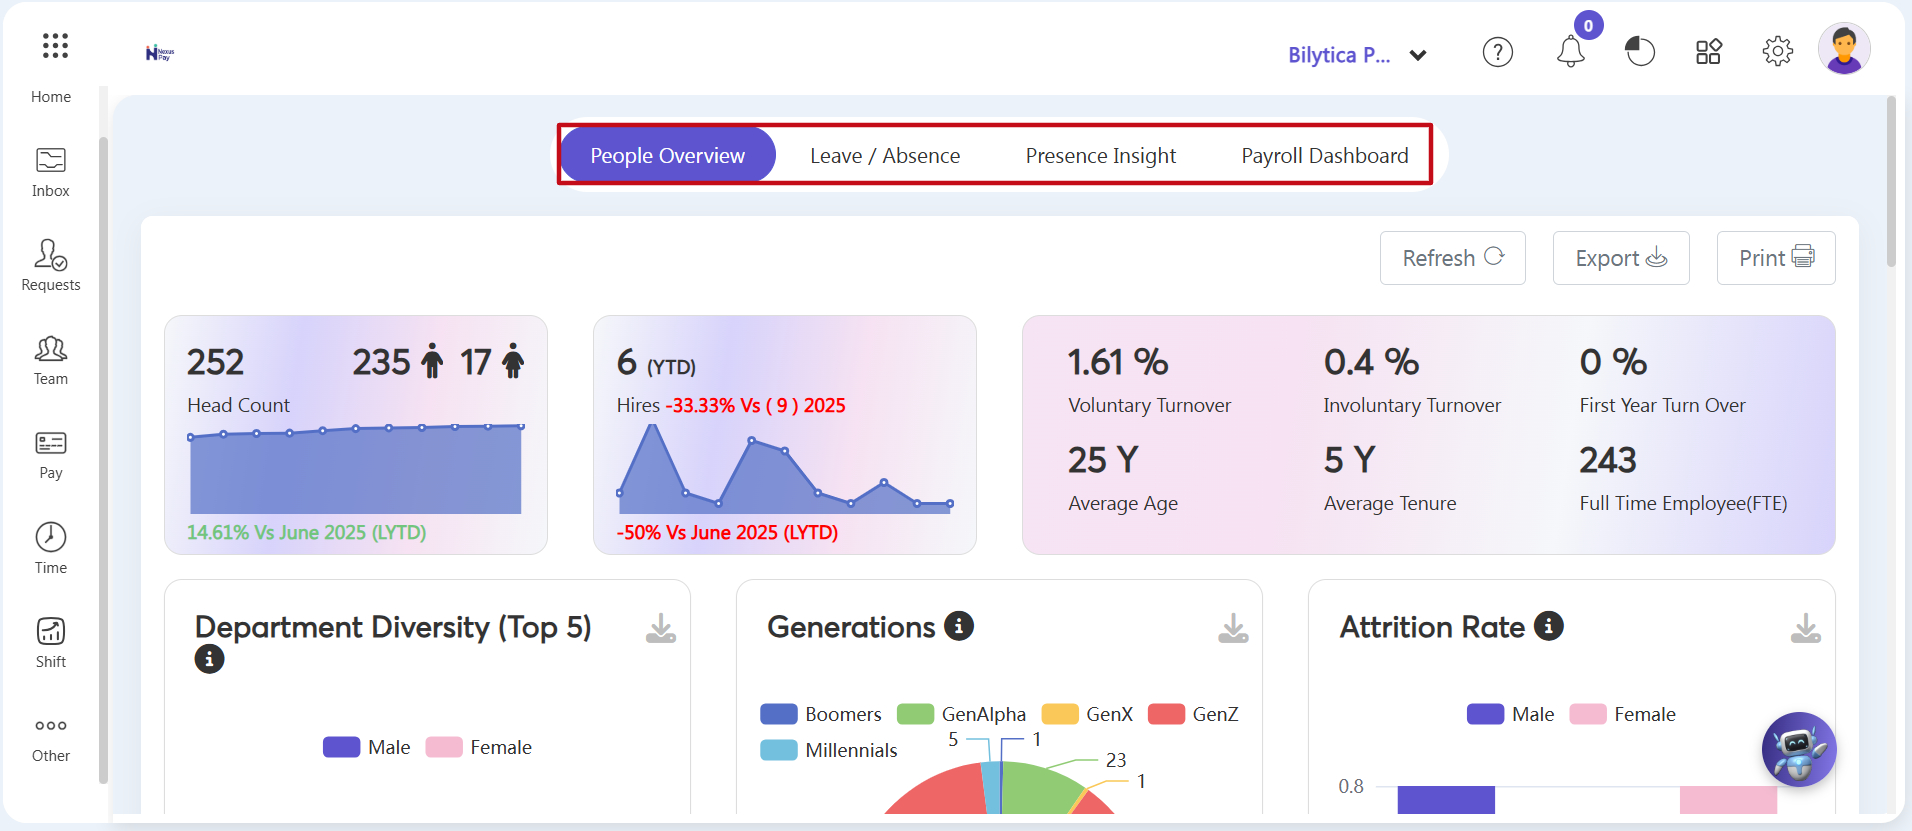
The analytics workspace features four standalone reporting tabs at the top of the page. Select a tab to view specific graphical data and trends:
Dashboard A: People Overview
Click this tab to review high-level organizational and employee metrics:
- Headcount Metrics: View active employee numbers with real-time comparative charts.
- Turnover Tracking: Monitor voluntary, involuntary, and first-year employee turnover rates.
- Diversity & Demographics: Analyze staff age generations (Gen Z, Millennials, etc.) and gender distributions across different departments.
Dashboard B: Leave / Absence
Click this tab to monitor how time-off and leaves are utilized:
- Absence Ratios: Track the exact percentage of approved leaves versus unannounced absences.
- Department Comparisons: Compare absence records by location, department, or job title to spot unusual trends.
Dashboard C: Presence Insight
Click this tab to view daily attendance and time-tracking data:
- Punctuality Analysis: See percentages for on-time arrivals, absences, early departures, and late-ins.
- Attendance Patterns: Track historical attendance trends across shifts to improve regional scheduling.
Dashboard D: Payroll Dashboard
Click this tab to review the company’s financial compensation spending:
- Component Breakdowns: View visual graphs by location or department showing breakdowns of Basic Pay, Allowances, Deductions, and Company Contributions.
- Overtime Cost Tracking: Monitor cumulative overtime spending by department or office to manage budgets before finalizing payroll.
Step 3: Refresh, Export, or Print — Use the action toolbar in the upper right corner of any dashboard to instantly update the data, export reports, or print visual charts.
Executive Business Intelligence Pro-Tip: |